Use Code WELCOME20 -20% OFF for 10k Challenge and Up
How to Read Candlestick Charts
How to Read Candlestick Charts
Introduction
Candlestick charts are the most widely used charting method in trading. They visually display price movement over time and help traders understand market behavior, sentiment, and momentum at a glance.
Learning to read candlestick charts is a foundational skill. Before indicators, strategies, or complex models, traders must understand how price itself is moving. Candlesticks are the language of the market.
What Is a Candlestick?
A candlestick represents price movement over a specific time period. That time period depends on the selected timeframe, such as one minute, one hour, or one day.
Each candlestick contains four key pieces of information:
Opening price
Closing price
Highest price
Lowest price
This information is compressed into a single visual unit, making it easier to interpret price behavior quickly.
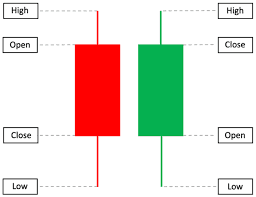
Anatomy of a Candlestick
A candlestick consists of two main parts:
The body: shows the range between the open and close
The wicks (or shadows): show the high and low reached during the period
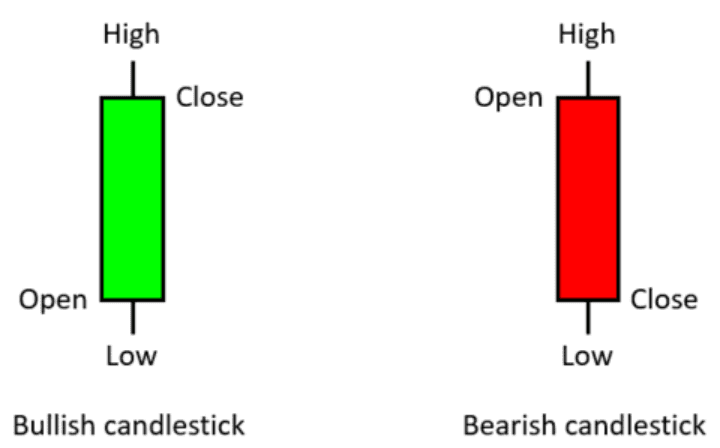
If the close is higher than the open, the candle is typically bullish.
If the close is lower than the open, the candle is typically bearish.
The size of the body and wicks provides insight into buying and selling pressure.
Bullish and Bearish Candles
Bullish candles indicate that buyers were in control during that period. The larger the bullish body, the stronger the buying pressure.
Bearish candles indicate that sellers dominated. Strong bearish candles suggest aggressive selling or rejection of higher prices.
Candles do not predict the future on their own. They describe what just happened in the market.
What Candlestick Size Tells You
Candlestick size reflects market activity and conviction.
Large candles suggest strong momentum and commitment
Small candles suggest indecision or low participation
A series of large candles often appears during strong trends or news-driven moves, while small candles are common during consolidation or low-liquidity periods.
Understanding Wicks and Rejection
Wicks show where price attempted to go but failed.
Long upper wicks suggest rejection of higher prices
Long lower wicks suggest rejection of lower prices
Rejection does not automatically mean reversal. It signals that one side attempted to push price but was met with opposing pressure.
Context is essential when interpreting wicks.
Candlestick Patterns (Conceptual, Not Memorization)
Certain candle formations are commonly discussed, such as pin bars, engulfing candles, or inside bars. However, patterns should not be memorized mechanically.
What matters is the story behind the candle:
Where did it form?
Was price trending or ranging?
Did it occur near key levels?
Candles gain meaning from context, not from shape alone.
Candlesticks and Timeframes
Candlesticks look different depending on timeframe.
Lower timeframes show more detail but more noise.
Higher timeframes show cleaner structure but fewer signals.
Professional traders often analyze higher timeframes for direction and lower timeframes for execution.
Common Beginner Mistakes
Many beginners misuse candlesticks by:
Trading single candles in isolation
Ignoring overall trend or structure
Overreacting to wicks without context
Treating patterns as guarantees
Candlesticks are tools for reading behavior, not signals to trade blindly.
Key Takeaway
Candlestick charts visualize the battle between buyers and sellers. Each candle tells a story about pressure, momentum, and rejection. Mastering candlesticks means learning to read price behavior within context, not memorizing patterns or chasing signals.
